
Introduction
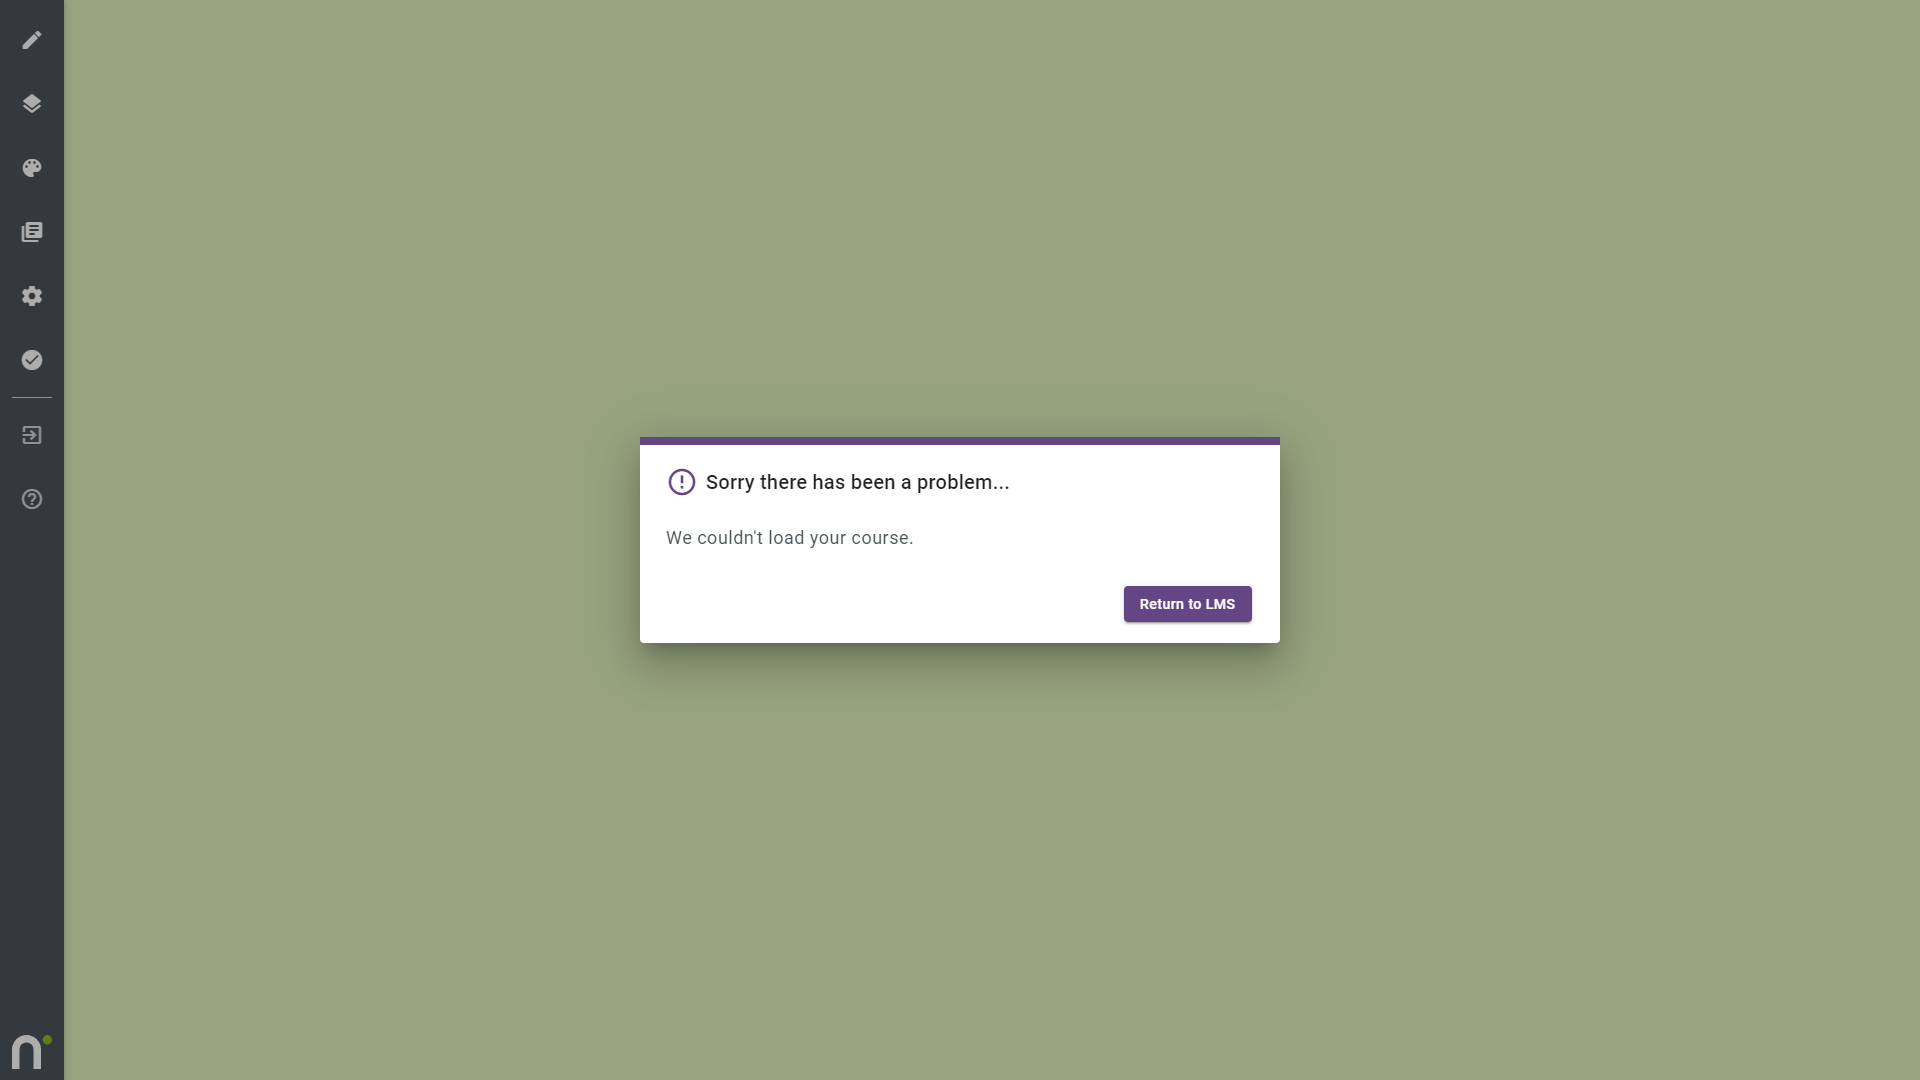
Sometimes, if you’re experiencing difficulties with Nimble, we might ask you to open the developer tools in your browser and send us a screenshot of what you see.
Top tips before you begin
This article provides instructions for accessing the developer tools in Google Chrome.
- If you are using Mozilla Firefox, see the equivalent article here.
- If you are using Microsoft Edge, see the equivalent article here.
How to access the developer tools in Google Chrome
- Whilst working in Google Chrome, complete the actions that cause the problem or error message that you have been experiencing.
- Once the error has occurred, press the F12 key on your keyboard – this should open the Developer tools. If it doesn’t, try pressing Ctrl + Shift + I.
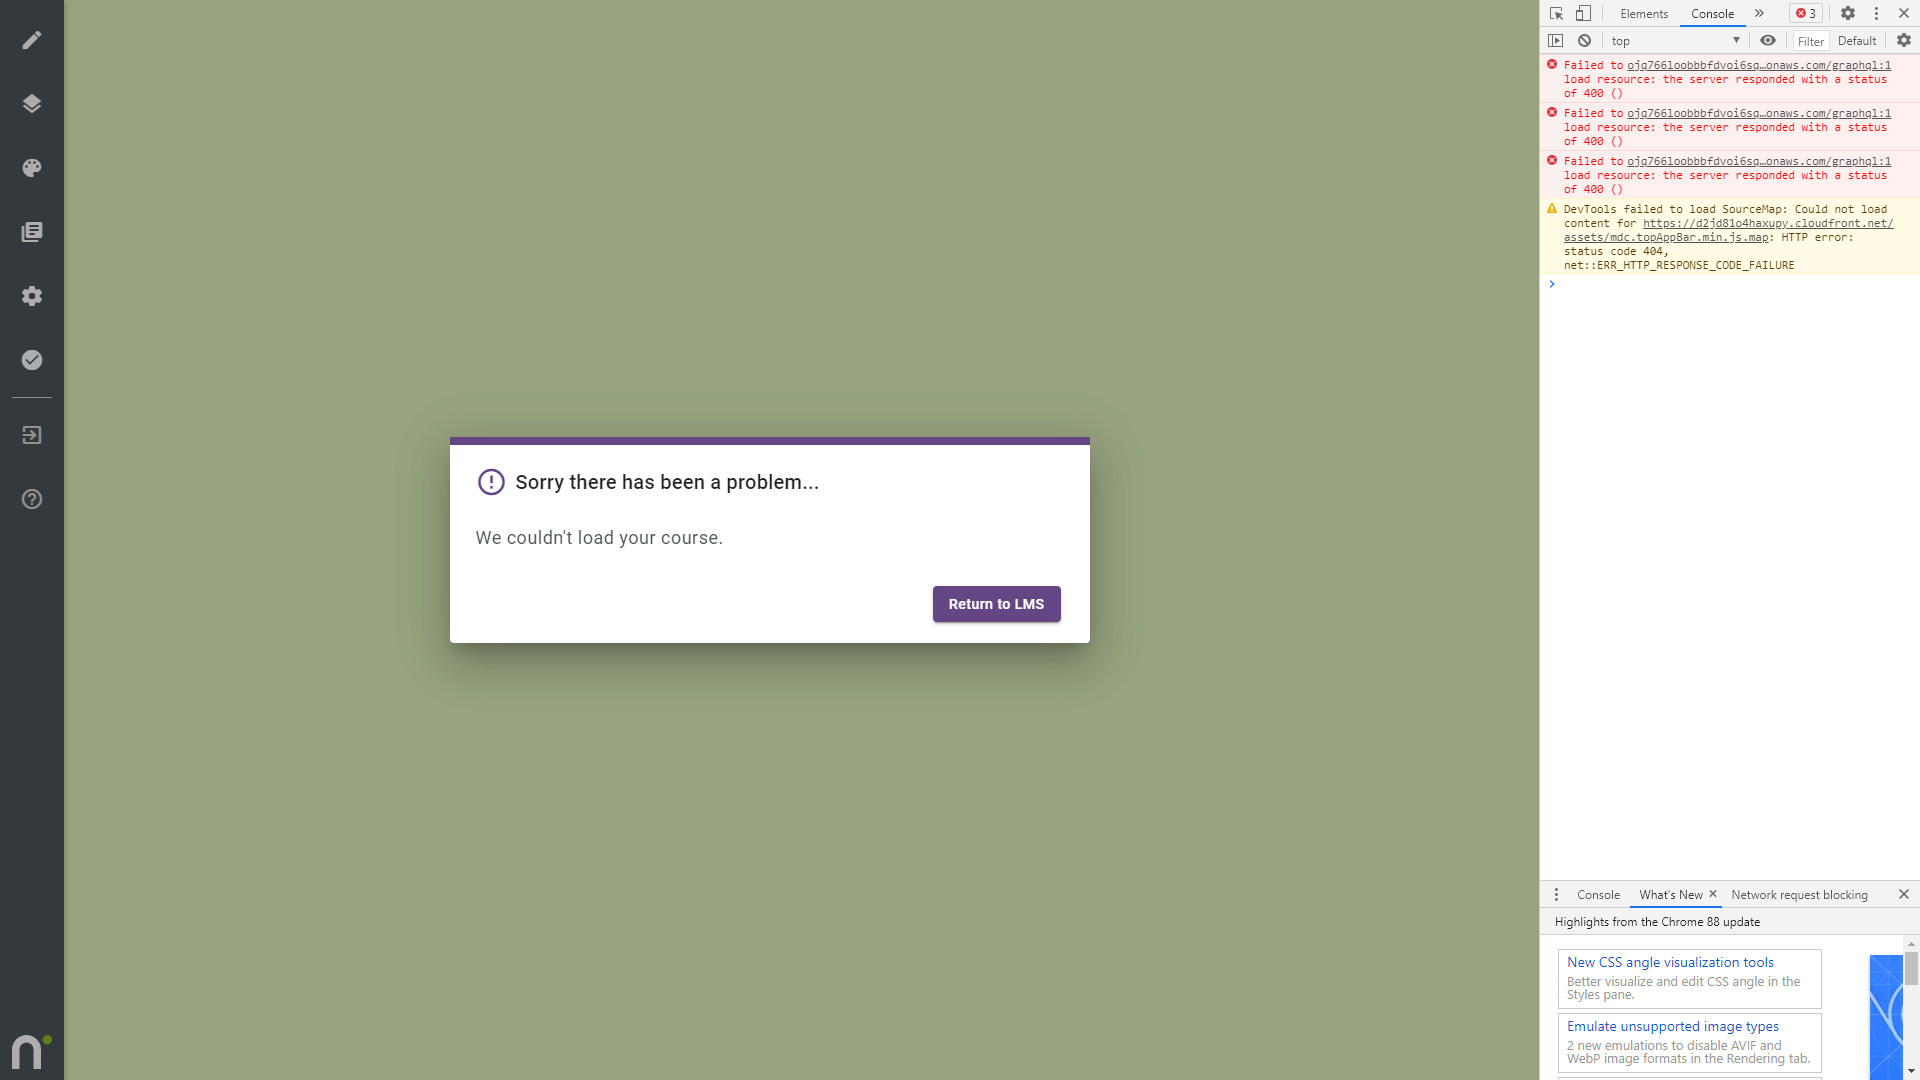
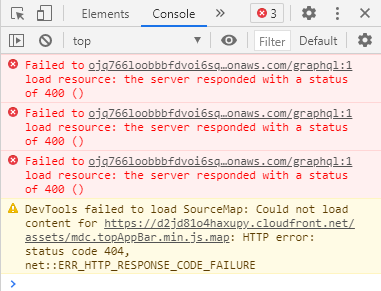
- From the top of the developer tools, ensure that the Console tab is selected.
- Take a screenshot of the full screen and send the screenshot to our technical team.
Please note: to take a full page screenshot; on Windows: locate the 'Print Screen' key on your keyboard. It's usually in the upper-right-hand corner, above the “SysReq” or "PgUp" button and often abbreviated to “PrtSc.” Press the main Win key and PrtSc at the same time - this will take a screenshot of the entire current screen.
On mac: press and hold these three keys together: Shift, Command and 3. If you see a thumbnail in the corner of your screen, click it to edit the screenshot. Or wait for the screenshot to be saved to your desktop.
Comments
0 comments
Article is closed for comments.